I am often asked the question, “what does it feel like running a business?”.
For many people, including myself, it feels like I’m piloting an airplane. You are sort of in control, but you’re continuously being affected by the weather (both good and bad). You need to rely on an intelligent piece of engineering – the engine – to keep you airborne, but yet you don’t really know the intricate details of how this engine works, apart from a series of dashboards and dials, into which you wholeheartedly put your faith.
These dashboards of course need to be in real-time to give you the benefit of being completely in control. Imagine if there were delays in these dashboards updating – you’d find yourself in an irreversible (and very serious) situation.
Like piloting a plane, running a business would be extremely difficult if it weren’t for analytics dashboards that provide instant insights into what’s happening.
Indeed, we recently discussed this very same scenario with one of our customers. They wanted at-a-glance updates about their company’s performance, so that they could be better informed about the direction they were going in. And so we suggested that they make good use of their company intranet software to bring this data to the forefront.
An intranet dashboard example in action
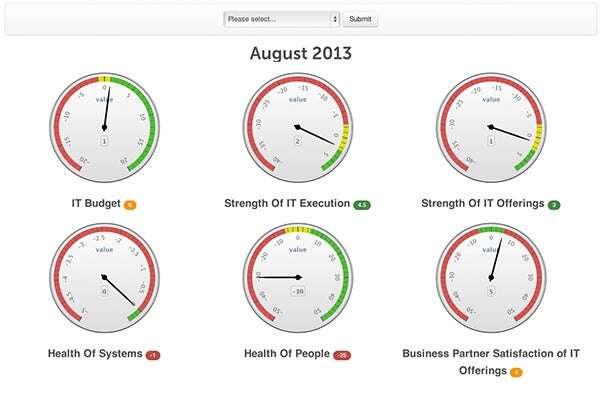
To help our client, we created a dial-based intranet dashboard showing how their business was performing in real time. Data was fished from various sources, such as budgets, employee engagement levels, and project progress, and integrated into one business intranet dashboard, allowing their management team to have a clear overview of important business metrics.
Check out one of their intranet dashboard examples below:

If you're looking for a bespoke dashboard or integration of your own, check out our custom development services or speak with one of our digital workplace experts.
This blog was originally written in 2013 by Claromentis co-founder and CTO Michael Christian. Follow more of his insights on Twitter: @michaelchri.


